BRIAN LUDWIG JR
INSTRUCTIONAL DESIGN
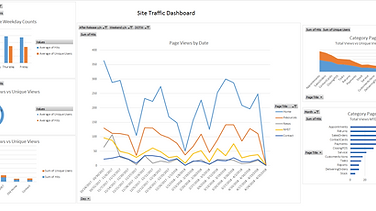
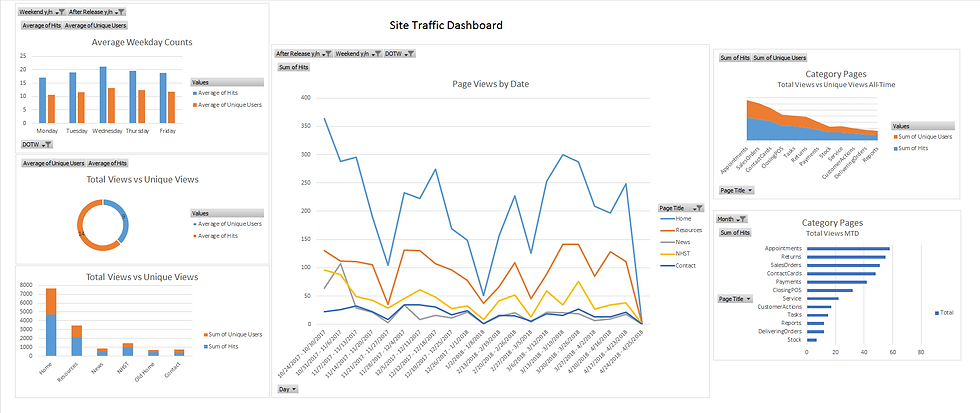
Training Site Traffic Dashboard
This site traffic dashboard was created to gauge effectiveness of self-help resources in the Training Resource Library.
About This Project
The dashboard looked at total and unique visitors to the Training Resource Library, which contained quick guides, helpful videos, and manuals. The results were compared with support desk call logs at biweekly meetings to measure the demand and effectiveness of self-paced training materials. Using both tools together helped the training team gather insights into employee behavior and better understand how employees preferred to learn.
Insights included:
Topics where learners prefer self-help
topics where learners prefer live support
Topics where further communication or training is needed
Instances When self-help resources do not help to decrease support calls
Materials that are no longer being accessed, Materials that are accessed the most
The project also included a video to promote the launch of the learning function's training and support portal.
How it Works
This dashboard answered only the questions it needed to in a simple visual format. Site hits were collected in SharePoint and aggregated in a master spreadsheet. From there, the pivot charts did all the work.
Key takeaways of this project:
The benefit of this dashboard was the conversations that it helped create
Team members used this simple dashboard in combination with call logs and observations to have meaningful conversations, instead of focusing solely on stats
You might also like...

Lesson Plan Template & Calendar
Making sense of a new rotating schedule was a breeze after a NJ high school implemented this lesson plan calendar.

Course Vitality Dashboard
This dashboard helped the Training and Instructional Design team take a comprehensive look at the strength of their course catalog.
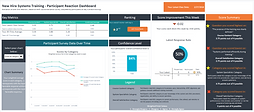
Trainer Reaction Dashboard
How am I doing? Every trainer wants to know that they're helping their learners succeed. This dashboard helped determine just that.